As Featured In
Study The Data.
Study the same 2.5 Billion data points, politician disclosures, and dark pool reference data covered in professional research—at a fraction of professional terminal costs. For educational and informational purposes only.
Data Flow
Disclosures
Financials
Pattern Insights
Explore The Market's
Track retail investor sentiment and positioning in real-time. Our sentiment data shows how retail readings have shifted historically—and how extreme fear or greed readings have correlated with market turning points in the past. Educational reference data only.
Tracking
Pattern Data
Historical Data
Detection
AAPL
NASDAQ • Technology| METRIC | FY19 | FY20 | FY21 | FY22 | FY23 | FY24 |
|---|---|---|---|---|---|---|
| Revenue (B) | 260.2 | 274.5 | 365.8 | 394.3 | 383.3 | 391.0 |
| Net Income (B) | 55.3 | 57.4 | 94.7 | 99.8 | 97.0 | 93.7 |
| Gross Margin | 37.8% | 38.2% | 41.8% | 43.3% | 44.1% | 46.2% |
| FCF (B) | 58.9 | 73.4 | 93.0 | 111.4 | 99.6 | 108.1 |
AL STOCK TRADES
| Capability & Data Stream | Access Level | Access Level |
|---|---|---|
| Institutional Data Suite — Reference Market Data Feeds | ||
| Options Flow Data | LIVE | — |
| Enhanced Options Flow Tools | LIVE | — |
| Algo Flow Data | LIVE | — |
| Dark Pool Trade Data | LIVE | — |
| Golden Sweeps Data | LIVE | — |
| Unusual Options Activity Data | LIVE | — |
| Interactive Charting Tools | LIVE | LIVE |
| Stock Screener | LIVE | LIVE |
| Fear And Greed Index | LIVE | — |
| Quantitative & Valuation Models (Educational) | ||
| P/E Valuation Model — Cyclical Bands & Episode Statistics (Educational) | LIVE | — |
| P/S Valuation Model — Cyclical Bands & Episode Statistics (Educational) | LIVE | — |
| FCF Multiple Valuation Model — EV/FCF & Market Cap/FCF (Educational) | LIVE | — |
| Intrinsic Value Software — DCF Multi-Scenario Model (Educational) | LIVE | — |
| Intrinsic Value Simulator — Stochastic Price Modeling (Educational) | LIVE | — |
| Peer Relative Valuation — Z-Score Heatmap (Educational) | LIVE | — |
| Financial Projections Calculator — Bull/Base/Bear Revenue Scenarios (Educational) | LIVE | — |
| VIX Quantitative Model — Threshold Episodes & Forward-Return Statistics (Educational) | LIVE | — |
| Earnings Reaction & Post-Earnings Drift Analyzer (Educational) | LIVE | — |
| Sector Earnings Beat Tracker (Educational) | LIVE | — |
| Dividend Coverage & Income Projection Engine (Educational) | LIVE | — |
| Disclosures & Activity Tracking (Educational) | ||
| Institutional Ownership Deep Dive — 13F Analytics (Educational) | LIVE | — |
| Insider + Congress Activity Tracker (Educational) | LIVE | — |
| Analyst Revision Momentum Tracker (Educational) | LIVE | — |
| Quantitative Backtesting & Episode Models (Educational) | ||
| Quantitative Large vs Small-Cap Sentinel Model — SPY/IWM RSI (Educational) | LIVE | — |
| Relative Rolling Returns — SD Bands & Z-Score Analyzer (Educational) | LIVE | — |
| Multi-Year Return Streak Analyzer — SPX & IWM (Educational) | LIVE | — |
| Multi-Asset Basket vs Benchmark Streak Analyzer (Educational) | LIVE | — |
| YTD Multi-Signal Search Terminal (Educational) | LIVE | — |
| Sector Rotation Radar — Contrarian Pattern Scanner (Educational) | LIVE | — |
| Dragon Analysis Terminal — Cash Flow Quality Classifier (Educational) | LIVE | — |
| Financial Statement Analytics (Educational) | ||
| Tri-Statement Financial Insight Engine — 40+ Year Income, Balance Sheet, Cash Flow (Educational) | LIVE | — |
| Financial Engineering Ratios Engine (Educational) | LIVE | — |
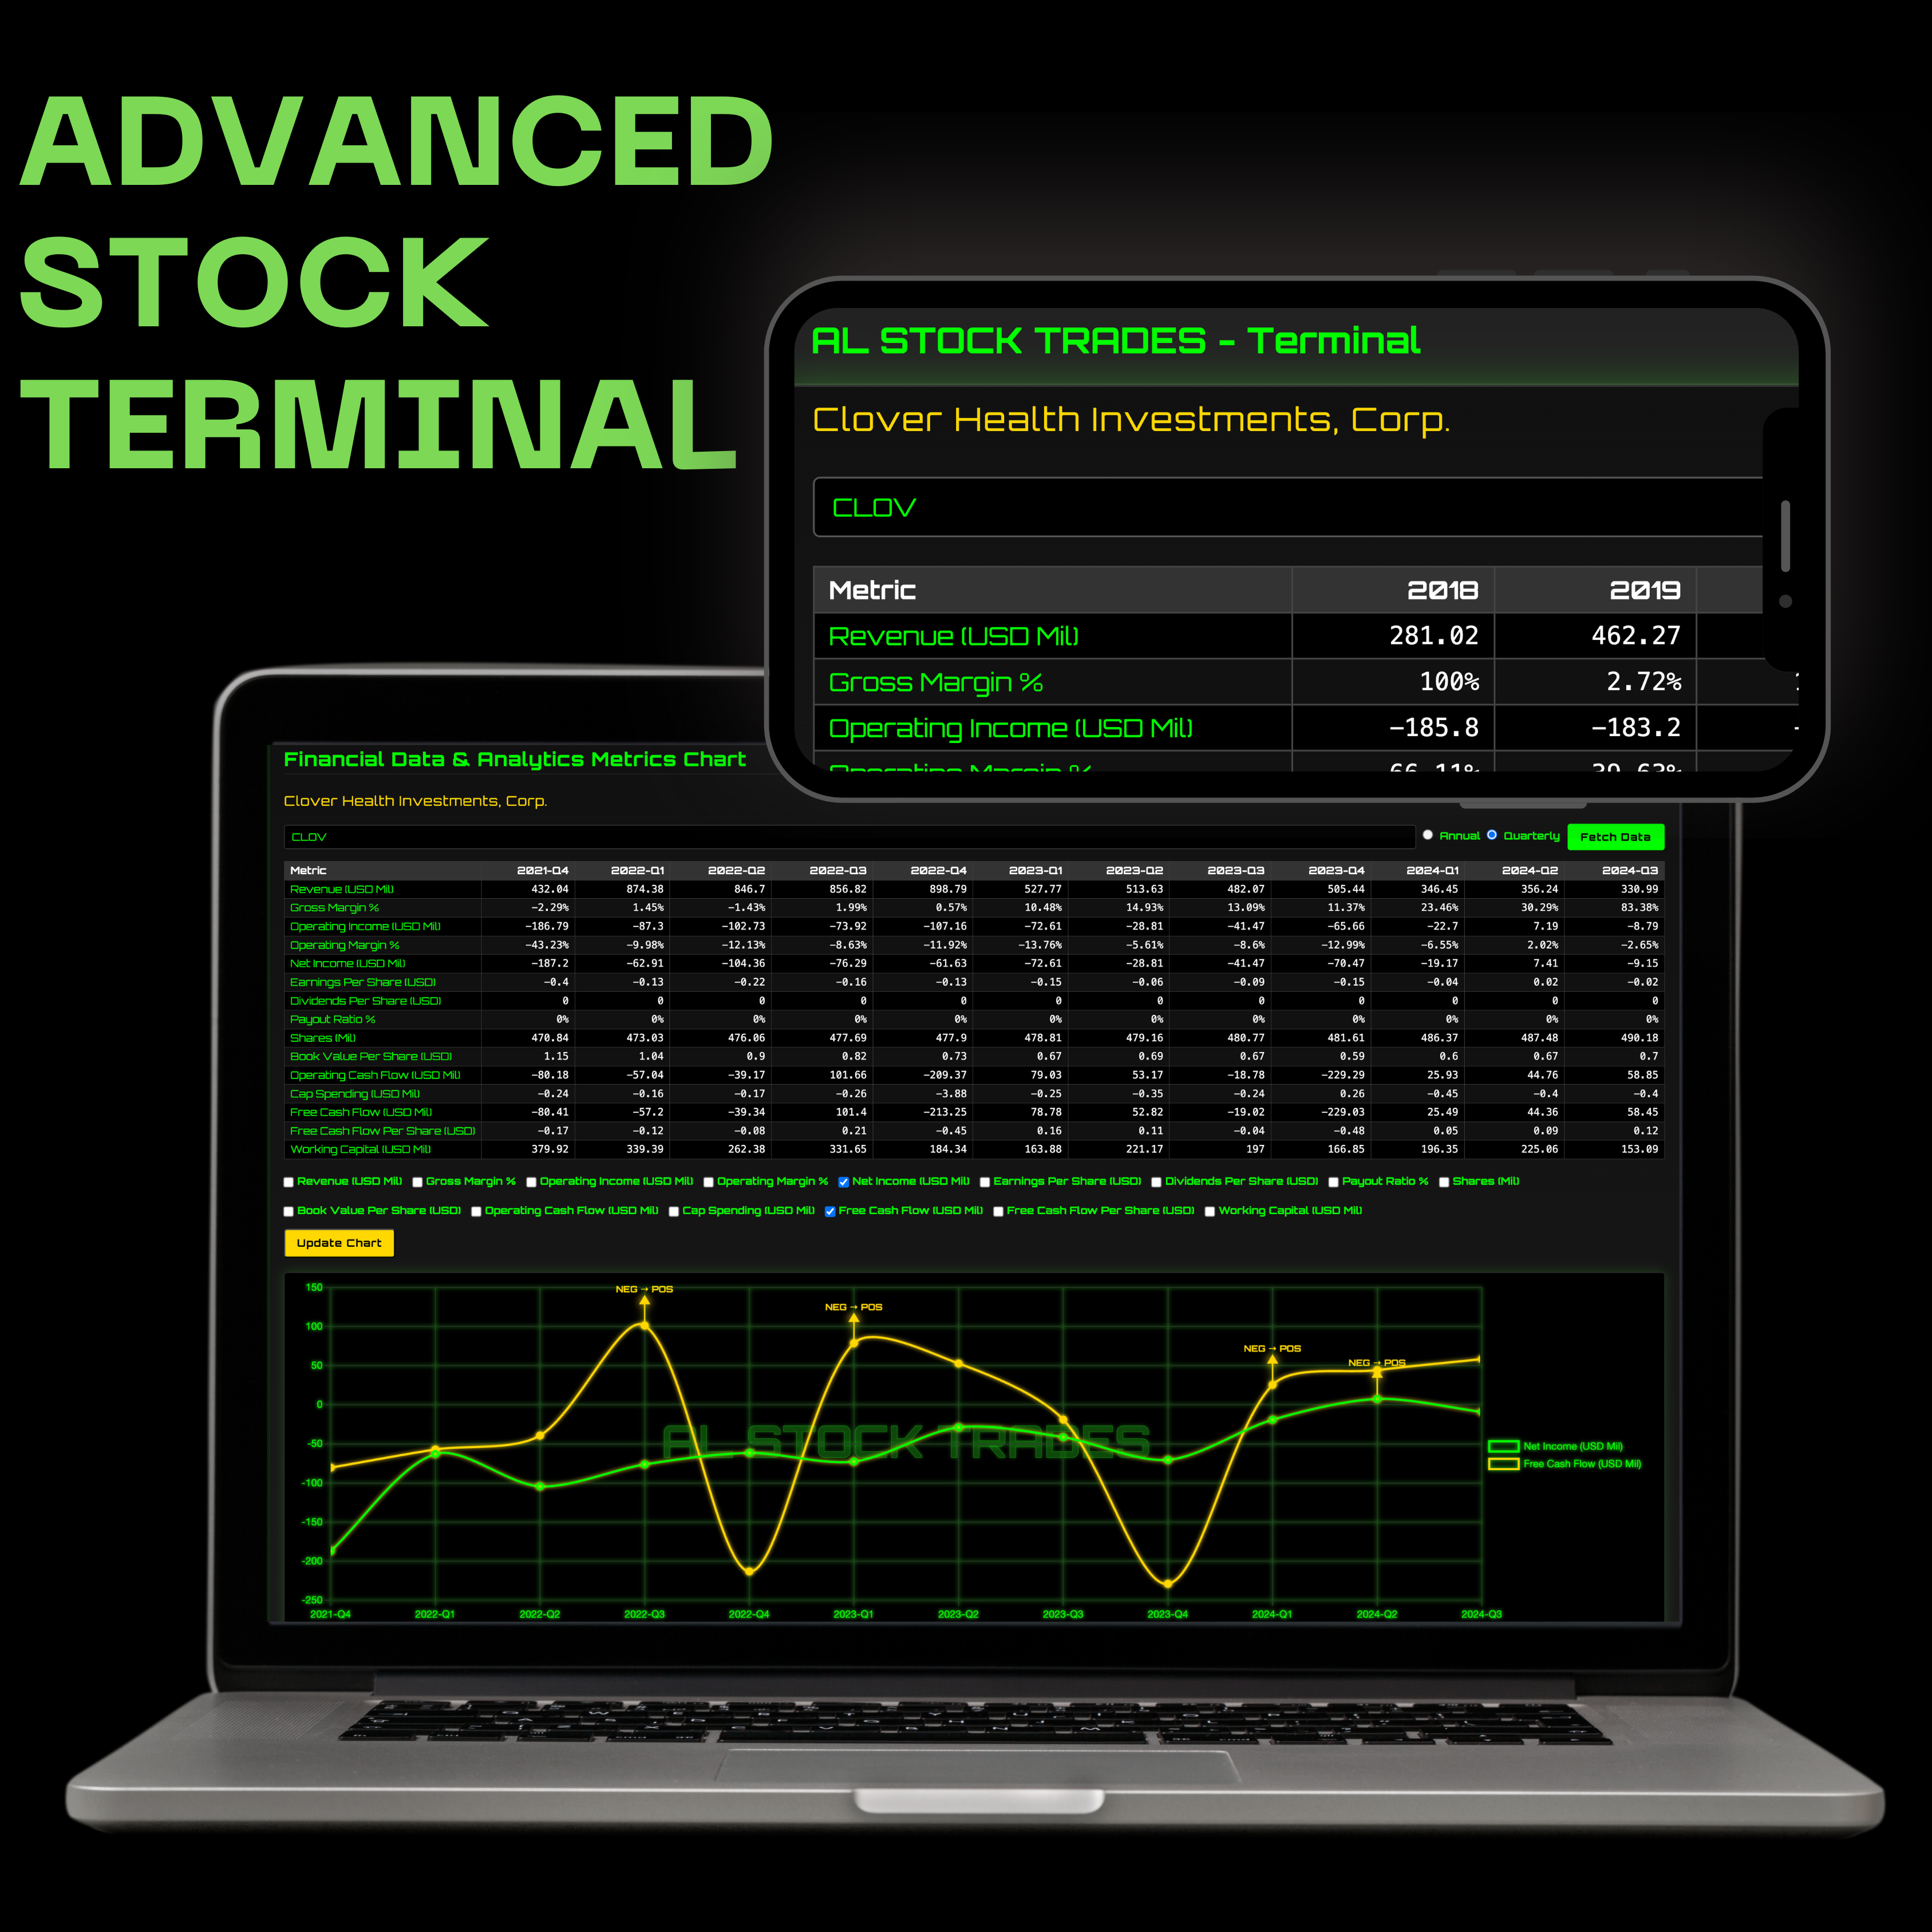
| Financial Data & Analytics Metrics Chart — 17+ Metric Visualization (Educational) | LIVE | — |
| Earnings Transcript Analyzer — 40+ Year Call Library + N-Gram Analysis (Educational) | LIVE | — |
| Institutional Ownership Graphs — Multi-Metric Visualization (Educational) | LIVE | — |
| Sentiment & Behavioral Models (Educational) | ||
| Market Sentiment Intelligence — Institutional vs Retail Confidence (Educational) | LIVE | — |
| Predictive Sentiment Terminal — ML News Analysis (Educational) | LIVE | — |
| Advanced Sentiment Terminal — News Dictionary Scoring (Educational) | LIVE | — |
| Technical Analysis & Charting Terminals (Educational) | ||
| Technical Analysis Terminal — Multi-Timeframe with AI S/R Clustering (Educational) | LIVE | — |
| QuantFlow Terminal — Cumulative Volume Delta Analysis (Educational) | LIVE | — |
| Educational & Software Architecture | ||
| Fundamental Analysis Course | LIVE | — |
| Valuation Methodology Course | LIVE | — |
| Technical Analysis Course | LIVE | — |
| Options Education Course | LIVE | — |
| Valuation Analysis Software (Educational) | LIVE | — |
| Price-to-Projected-Sales Software (Educational) | LIVE | — |
| 40+ Year Projection Tool (Educational) | LIVE | — |
| Book Value Software (Educational) | LIVE | — |
| Stability Software (Educational) | LIVE | — |
| Coverage Universe — Earnings & Valuation Suite (Educational) | ||
| S&P 500 — Sector Earnings Beat Tracker (Educational) | LIVE | — |
| S&P MidCap 400 — Sector Earnings Beat Tracker (Educational) | LIVE | — |
| Russell 3000 — Sector Earnings Beat Tracker (Educational) | LIVE | — |
| Russell 2000 — Sector Earnings Beat Tracker (Educational) | LIVE | — |
| BEAT / MISS / INLINE Quadrant Analytics by Sector & Period (Educational) | LIVE | — |
| EPS & Revenue Surprise % — Net Sector Pull, Beat-Miss Spread (Educational) | LIVE | — |
| Cyclical High/Low Bands + Episode Signals — 40+ Year Lookback (Educational) | LIVE | — |
| SMA / SMA50 / SMA200 Overlays — All Universes (Educational) | LIVE | LIVE |
| Market Intelligence Layer | ||
| Real-time Charts and Stock Quotes | LIVE | LIVE |
| 40+ Years of Historical Financial Data | LIVE | LIVE |
| Global Equities Universe — 44 Countries & 60+ International Stock Exchanges | LIVE | — |
| Daily Market Education | LIVE | LIVE |
| Fair Value Analysis (Educational) | LIVE | LIVE |
| Investing Education Community | LIVE | — |
| Connectivity & Alternative Data | ||
| Mobile/Web Access | LIVE | LIVE |
| News Feed | LIVE | LIVE |
| Earnings Data | LIVE | LIVE |
| AI Market Pattern Examples | LIVE | — |
| Short-Term Pattern Education | LIVE | — |
| Breakout Pattern Examples | LIVE | — |
| Crypto Market Education | LIVE | — |
| AI Support/Resistance Charts (Educational) | LIVE | — |
| BrainMachine Target Calculation (Educational) | LIVE | — |
The information, data, software tools, models, scanners, trackers, indicators, courses, charts, transcripts, and other features displayed in this comparison and offered through AL STOCK TRADES — whether developed by us or by third-party providers — are provided strictly for informational and educational purposes only. Nothing presented herein constitutes or should be interpreted as personalized investment advice, financial planning, tax advice, legal advice, or a recommendation to buy, sell, hold, or refrain from buying, selling, or holding any security, derivative, cryptocurrency, or other financial instrument.
No Registered Adviser Relationship. AL STOCK TRADES is not a registered investment adviser (RIA), broker-dealer, financial planner, or fiduciary under U.S. securities laws or the laws of any other jurisdiction, and does not act in any such capacity. No advisory, fiduciary, brokerage, custodial, or principal-agent relationship is created by your access to, registration with, or use of this platform, regardless of frequency of use, payment, or duration.
Reference Data, Not Trading Signals. Raw market data feeds — including but not limited to options flow, dark pool prints, golden sweeps, unusual options activity, algo flow, insider transactions, congressional disclosures, 13F filings, earnings transcripts, news sentiment, and similar — are provided as reference data only. They are not trading signals, alerts, recommendations, or instructions to act. Educational analytics, valuation models, episode trackers, sentiment scores, backtested returns, pattern scanners, and forward-return statistics are illustrative tools for general market research and pedagogy, not personalized advice.
Not Tailored to Your Situation. All tools, indicators, courses, software, and algorithms are intended to support general market education and research. They are not tailored to any individual’s financial situation, investment objectives, time horizon, liquidity needs, tax position, or risk tolerance. Whether any feature, idea, or output is appropriate for you is a determination only you and your own licensed advisors can make.
Past Performance. Past performance of any strategy, tool, model, signal, episode statistic, backtest, projection, simulation, or third-party reference is not indicative of and does not guarantee future results. Forward-looking projections, Monte-Carlo simulations, and probability estimates are inherently uncertain and may differ materially from actual outcomes. Hypothetical and backtested performance results have inherent limitations and do not represent actual trading.
Investment Risk. All investing in securities, derivatives, options, futures, cryptocurrencies, and other financial instruments involves substantial risk, including the possible total loss of principal. You should not invest funds you cannot afford to lose. Options and derivatives can lose 100% of premium and may carry obligations beyond initial investment. Cryptocurrencies can lose nearly all value and trade in unregulated venues.
Third-Party Content “As Is”. Any third-party data, content, charts, news, transcripts, ratings, analyst estimates, or services available through this platform are provided “as is” and “as available,” without warranties of any kind, express or implied, including warranties of merchantability, fitness for a particular purpose, accuracy, completeness, timeliness, non-infringement, or uninterrupted availability. AL STOCK TRADES does not guarantee any third-party resource and assumes no liability for any decisions or actions taken based on them.
Your Sole Responsibility. By accessing or using any product, service, or feature shown, you acknowledge and agree that you are solely responsible for your own financial decisions and that you should consult with a licensed financial advisor, tax professional, and/or attorney before acting on any information presented through AL STOCK TRADES. To the maximum extent permitted by law, AL STOCK TRADES, its affiliates, officers, directors, employees, content providers, and licensors disclaim all liability for any direct, indirect, incidental, consequential, special, or punitive damages — including but not limited to lost profits, lost opportunity, or trading losses — arising from your use of or reliance on this platform, even if advised of the possibility of such damages.
SAMPLE PRICE TARGET
Who Am I // Albert Alan, MD
Founder & Educator | AL STOCK TRADES | Global Neurosurgical Alliance
Formerly Homeless UA Grad Is Now One Step Closer to His Dream

Once Homeless Man to Receive 3 Degrees at Friday's UA Commencement

40 Under 40 Most Influential in the City of Tucson & State of Arizona

Hershey Medical Center teaches future generations at International Neurosurgery Resident Course

CEO Albert Alan's AL STOCK TRADES Achieves Milestone: Users Report Total Net Worth Growth Exceeding $45 Million
CEO Albert Alan Announces Formation of Strategic Real Estate Investment Firm with $50 Million, 15-Year Arizona Development Initiative

Video Testimonials

Lifetime Access Software
Professional-grade market data. One payment. Forever yours.

Mastering Software
Complete stock terminal with professional analytics suite
Everything in the Mastering terminal, built for learning and research. You drive 46+ educational models and tools spanning valuation (P/E, P/S, FCF, DCF), 13F, insider and congressional activity tracking, 40+ years of financial statements and earnings transcripts, sentiment scoring, and technical analysis, across the S&P 500, Russell 3000 and 60+ global exchanges. Plus the full investing course library, and it is yours for life.


Bundle Software
The complete terminal suite, now and forever
AL Stock Trades Intelligence is a separate paid upgrade: the agentic AI engine that operates your educational terminal suite for you. It reads charts, scans filings, analyzes earnings calls, screens sectors, and runs valuation models in real time. Ask it a single question and watch it pick the right terminal, pull the data, and lay out the educational analysis end to end, all for learning and research. Available to Bundle members only.